
A Deep Dive Into Active Equity ETFs
All things equal, investors tend to be better off in an ETF. Except when all things are not equal.
/s3.amazonaws.com/arc-authors/morningstar/c52d2eba-3a3c-478f-b3bd-c3ca80a5100f.jpg)

It seemed like they would never arrive; now they’re showing up among the biggest fund companies.
Active exchange-traded funds have gained momentum among once-skeptical active equity managers in recent years, in no small part because of the SEC’s ETF Rule. Most active managers had long been reluctant to give away their “secret sauce” by disclosing their holdings daily like other ETFs. Eventually, however, traditional fund companies have embraced ETFs as another distribution vehicle for their strategies. Companies like T. Rowe Price and Fidelity launched nontransparent ETFs by cloning existing strategies and keeping daily holdings opaque. Investors have preferred fully transparent ETFs, though, and nontransparent ETFs have garnered few assets. So, fund companies have shifted gears.
After T. Rowe Price’s 2020 nontransparent ETF launch fizzled, for example, it birthed a handful of fully transparent ETFs in 2023, including one run by star manager David Giroux. Even Capital Group, the parent of the conservative American Funds family, has gotten comfortable enough with the vehicle to launch in 2022 its own fully transparent active ETFs.
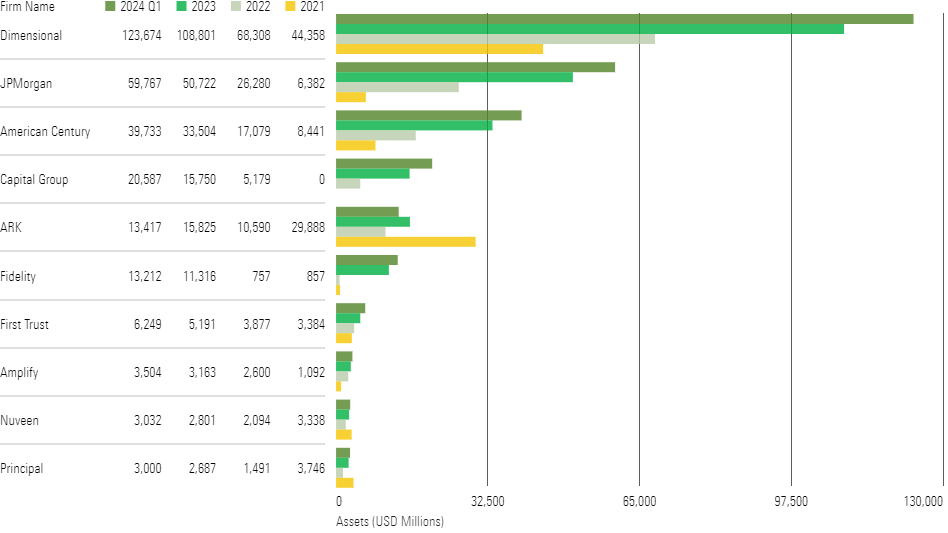
So far, three firms have dominated active equity ETF assets: Dimensional Fund Advisors, J.P. Morgan, and Avantis Investors (a subsidiary of American Century). As of year-end 2023, Dimensional topped the charts with $109 billion, followed by J.P. Morgan with $51 billion and Avantis with $33 billion. Fidelity and Capital Group have had success, too.
Total Equity Assets by Firm (in USD Millions)
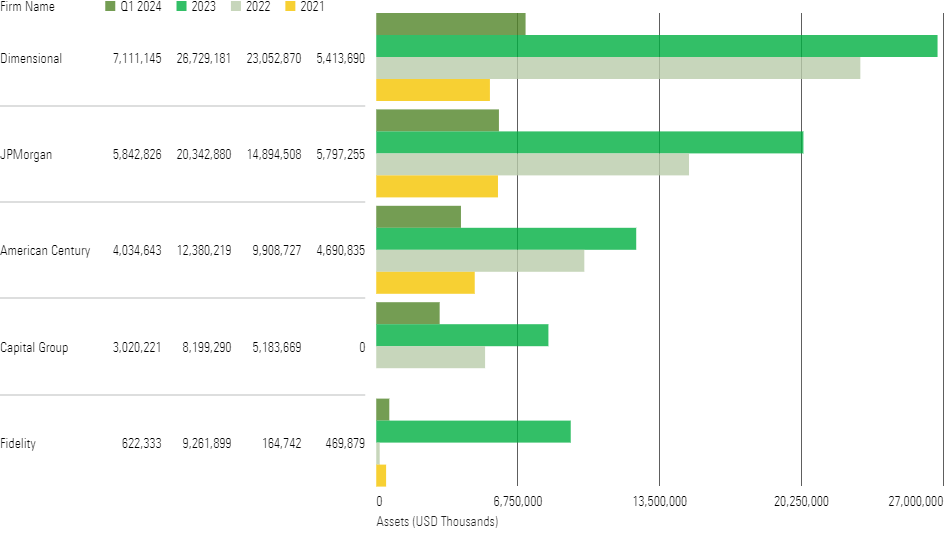
Estimated Equity Net Flows by Firm
Active Equity ETF Landscape
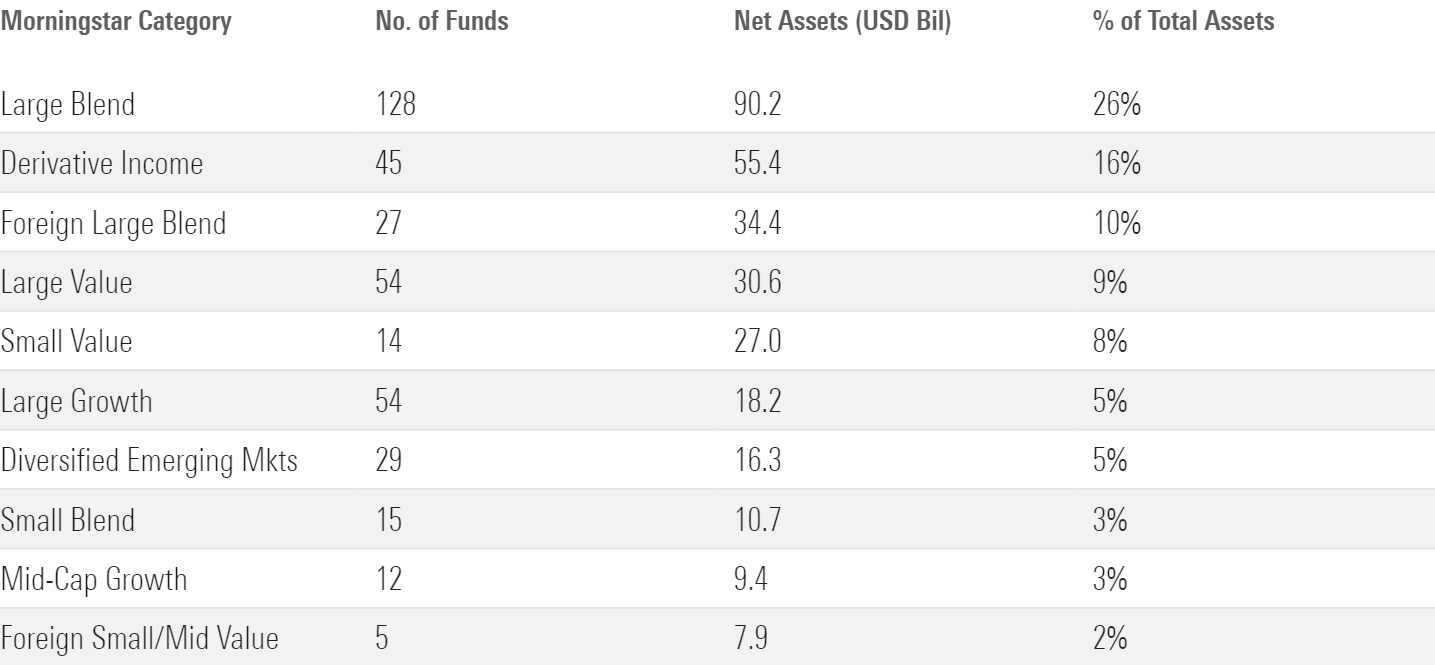
The large-blend Morningstar Category holds the most active equity ETF assets. Yet, assets have also accumulated in surprising places. The derivative income category is the second largest by assets, as J.P. Morgan’s two covered-call offerings, JPMorgan Equity Premium Income ETF and JPMorgan Nasdaq Equity Premium Income ETF, have been very successful.
Equity ETFs by Morningstar Category
Considerations for Active Equity ETFs
Liquid stocks are ideal given capacity constraints.
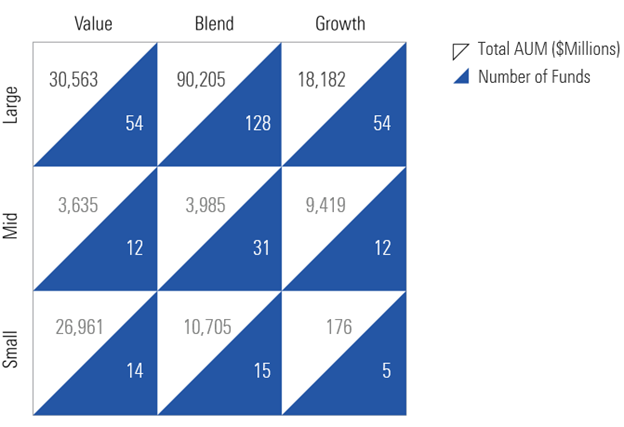
All active managers must know their funds’ capacity limits, or how big they can get before asset size impedes their strategies. Active ETF managers have to be especially careful because ETFs cannot close. ETFs with liquid, or frequently traded, holdings, like large-cap stocks, work best in the ETF wrapper, which is why active stock ETFs in large-cap categories hold the most assets, as shown below. Unfortunately, large-cap US stocks tend to be the toughest market for active managers to find a consistent edge over passive peers.
Number of ETFs and AUM by Morningstar Style Box
Broader portfolios extend capacity.
Concentrated active small- and mid-cap strategies can quickly run into capacity issues, but well-diversified portfolios, like those from Dimensional and Avantis, can forestall those problems. Active ETF assets in the small-value, -blend, and -growth Morningstar Categories all fall in the top 10 thanks to such offerings. These firms have been successful in less-liquid markets because they start with a broad portfolio as their target market, then tilt toward stocks with certain characteristics, like low valuations and high profitability, which often results in portfolios that spread their assets over hundreds or even thousands of stocks, limiting their capacity risk.
Follow these rules for foreign investing as well.
Another capacity-constrained market is emerging markets, where stocks tend to be less liquid than those in developed markets. Emerging-markets ETFs can have wider spreads and bigger gaps between their market prices and net asset values, so active strategies in this group also need to be well diversified to work as ETFs. Once again, Dimensional has had success running large emerging-markets strategies because they are more indexlike. Global large-cap strategies work well in ETF wrappers because they tend to focus on developed markets and larger emerging economies like China and India.
ETF clones offer several advantages, but understand the differences first.
All things equal, if a fund company offers a cheaper ETF clone of a traditional active mutual fund, investors are better off in the ETF. Except when all things are not equal.
Most ETF clones cost about the same as the institutional shares of the mutual funds. The former has other cost advantages over the latter, though. The ETFs usually distribute fewer capital gains than their mutual fund twins. Indeed, most American Century, Fidelity, and T. Rowe Price ETFs paid out zero capital gains in 2022 and 2023, unlike their mutual fund pairs. That could change as the ETFs accumulate embedded gains, but the ETF structure should still limit their tax costs.
Mutual funds also typically hold more cash than ETFs to meet redemptions. Dimensional’s and Avantis’ ETF clones often hold less than one fifth of the cash their corresponding mutual funds hold. The amounts are small but can still drag on a mutual fund’s performance relative to the ETF clones.
That said, the nontransparent ETFs clones can’t invest in foreign holdings or private companies, which can cause performance disparities with mutual fund siblings that dabble in such securities, such as those from Fidelity and T. Rowe Price. Investors need to know of these potential discrepancies before investing.
Top Firms’ ETF Approaches
ARK Investment Management
Style: Concentrated
Transparency: Fully Transparent
Fees: Below Average (75 basis points)
One of the most talked about active ETF players is ARK Investment Management, thanks to its outspoken leader, Cathie Wood. Wood launched the firm in 2014 and has established a broad media presence and enthusiastic following, which peaked following the covid pandemic. As high-growth technology firms prospered, so did ARK’s ETF lineup, which took in more than USD 20 billion in 2020, led by ARK Innovation ETF ARKK. By the end of 2020, ARK was by far the biggest active player, with more than $30 billion in assets, more than all other active equity ETF issuers combined. Assets peaked at $51 billion in early 2021 but quickly shrank as the ETF’s performance reversed. As of January 2024, ARK’s assets under management sat at $13 billion, and its fund lineup remained thematic and growth-focused.
American Century (and subsidiary Avantis)
Style: Concentrated (American Century) and Broadly Diversified (Avantis)
Transparency: Nontransparent (American Century) and Fully Transparent (Avantis)
American Century Fees: Low (39-45 basis points); clones are roughly 20 basis points cheaper than institutional share class, slightly cheaper than R6 share class
Avantis Fees: Low (15-42 basis points); clones priced similar to mutual fund
American Century joined the active ETF market in 2018 by launching two fixed-income strategies, but they didn’t make their mark until former Dimensional co-CEO Eduardo Repetto launched Avantis from within American Century in 2019. The firm now lists 43 ETFs, with 27 coming from Avantis, which accounts for more than 90% of American Century’s $36 billion in AUM. Avantis US Small Cap Value ETF AVUV has garnered more than $9 billion in assets.
Six of Avantis’ equity ETFs had more than $1 billion in assets at year-end 2023. Several of American Century’s ETFs have similar mutual fund counterparts, including versions of American Century Focused Dynamic Growth ACFOX and Focused Large Cap Value ALVIX and are nontransparent. These have garnered few assets since their launches.
Capital Group
Style: Diversified
Transparency: Fully Transparent
Fees: Low (33-54 basis points); clones cheaper than most share classes
Capital Group, parent of American Funds, was late to the active ETF party but launched its first ETFs in February 2022. These included five fully transparent equity strategies and one fixed-income strategy that take very similar approaches to some insurance accounts they manage. As fully transparent ETFs that report their holdings daily, Capital’s vehicles can own non-US securities that trade in different time zones—a feature unavailable to nontransparent ETFs, aside from ADRs and GDRs. So, Capital’s lineup includes international strategies. The firm now has a total of 14 ETFs.
Like all of Capital’s strategies, multiple independent managers run these ETFs. These strategies are not clones of American mutual funds, but they draw on managers from the same talent pool.
Dimensional Fund Advisors
Style: Broadly Diversified
Transparency: Fully Transparent
Fees: Low (12-43 basis points); clones priced similar to mutual fund
Dimensional first joined the ETF fray in late 2020 by launching three strategies. In 2021, Dimensional became one of the first asset managers to convert mutual funds into ETFs when it recast six tax-managed strategies. The firm now boasts 38 ETFs, including 28 equity ETFs. These new ETFs have proved popular among clients, and six of the top 10 active ETFs by assets are Dimensional’s, including Dimensional US Core Equity 2 DFAC, Dimensional US Marketwide Value DFUV, and Dimensional US Targeted Value DFAT, which all landed within the top five as of Dec. 31, 2023. Dimensional takes a similar approach across strategies to create indexlike portfolios that lean into factors such as size, valuation, and quality.
Fidelity
Style: Mixed
Transparency: Mixed (seven Nontransparent, 15 Fully Transparent equity ETFs)
Fees: Low to Below Average (18-59 basis points); clones mixed: some priced like K share class (employer-sponsored retirement plan) and some more expensive, like Fidelity Magellan ETF
Fidelity rolled out nine nontransparent active ETFs in 2020 and 2021, many of which were based on its existing strategies, such as Silver-rated Fidelity Blue Chip Growth ETF FBCG and Bronze-rated Fidelity Magellan ETF FMAG. The ETF versions of these strategies share the same managers as the mutual funds—including Blue Chip Growth’s Sonu Kalra and Magellan’s Sammy Simnegar. The Blue Chip Growth ETF’s portfolio looks a different around the edges than the mutual fund’s, while the Magellan ETF’s portfolio barely deviates from its mutual fund cousin. In 2023, the firm converted 12 equity mutual fund strategies to fully transparent ETFs.
J.P. Morgan
Style: Diversified
Transparency: Fully Transparent (except for one small-value ETF)
Fees: Low to Below Average (17-74 basis points); clones are priced roughly 20 basis points cheaper than institutional share classes, in line with R6 (qualified retirement plan)
J.P. Morgan first got into active ETFs with several fixed-income and alternative/hedge-fund-oriented strategies before the ETF Rule came out. In 2020, the firm launched its crown jewel covered call strategy, JPMorgan Equity Premium Income JEPI, which was the top-ranking active ETF by assets at the end of 2023. It later launched another covered call strategy, JPMorgan Nasdaq Equity Premium Income ETF JEPQ, which also ranks among the top five active ETFs by assets.
T. Rowe Price
Style: Diversified
Transparency: Mixed (five Nontransparent and five Fully Transparent equity ETFs)
Fees: Low to Below Average (31-57 basis points); clones priced comparably to institutional share class
T. Rowe Price also started with nontransparent ETFs of strategies like T. Rowe Price Blue Chip Growth TCHP and T. Rowe Price Growth Stock TGRW, both Silver-rated in 2020. The ETFs give investors without institutionalized assets access to well-managed strategies at institutional prices. Both ETF portfolios have more than 90% portfolio overlap with the mutual fund versions, eliminating only non-US holdings without ADRs and private companies, in which Blue Chip Growth has a small stake. Yet, those strategies haven’t had much success out of the gates, so the firm launched several fully transparent options, including T. Rowe Price Capital Appreciation Equity ETF TCAF, run by star manager David Giroux.
This article is an excerpt from Morningstar’s Guide to US Active ETFs, which can be found in full here.
The author or authors do not own shares in any securities mentioned in this article. Find out about Morningstar’s editorial policies.
/cloudfront-us-east-1.images.arcpublishing.com/morningstar/EGA35LGTJFBVTDK3OCMQCHW7XQ.png)
/cloudfront-us-east-1.images.arcpublishing.com/morningstar/ZHTKX3QAYCHPXKWRA6SEOUGCK4.png)
/d10o6nnig0wrdw.cloudfront.net/05-13-2024/t_4a71dba80d824d828e4552252136df22_name_file_960x540_1600_v4_.jpg)
:quality(80)/s3.amazonaws.com/arc-authors/morningstar/c52d2eba-3a3c-478f-b3bd-c3ca80a5100f.jpg)